
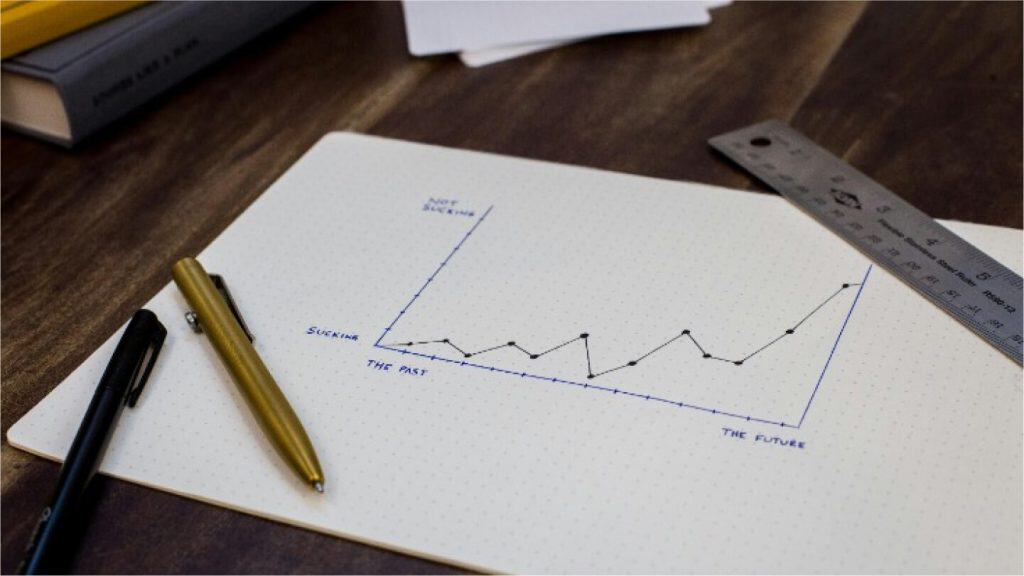
Demystifying Technical Analysis: A Beginner’s Guide to Chart Patterns and Indicators” offers an accessible entry point into the world of technical analysis, providing novice traders with the foundational knowledge needed to interpret charts and indicators effectively. This blog series breaks down complex concepts into simple, easy-to-understand terms, empowering beginners to make informed trading decisions based on technical analysis. From recognizing common chart patterns such as head and shoulders or triangles to understanding the significance of key indicators like moving averages and relative strength index (RSI), this guide equips traders with the essential tools for analyzing market trends and identifying potential entry and exit points.
Through practical examples and step-by-step tutorials, this series demystifies technical analysis, giving beginners the confidence to incorporate these powerful tools into their trading strategies. Whether you’re looking to enhance your understanding of price action or gain insights into market sentiment, mastering technical analysis is a crucial step towards becoming a successful trader. By equipping yourself with the knowledge and skills outlined in this guide, you’ll be better prepared to navigate the complexities of the financial markets and embark on your trading journey with clarity and confidence.
Technical analysis is the study of historical price and volume data to identify patterns and trends that may help forecast future market behavior. Unlike fundamental analysis, which examines a company’s financial health, industry position, and economic factors, technical analysis focuses primarily on charts. It rests on three core ideas: price reflects all available information, prices tend to move in trends, and history often repeats itself through recognizable patterns.
For beginners, technical analysis can seem overwhelming—filled with unfamiliar terms, colorful indicators, and complex charts. This guide breaks down the essentials of chart patterns and popular indicators in plain language so you can begin interpreting charts with greater confidence.
Understanding Price Charts
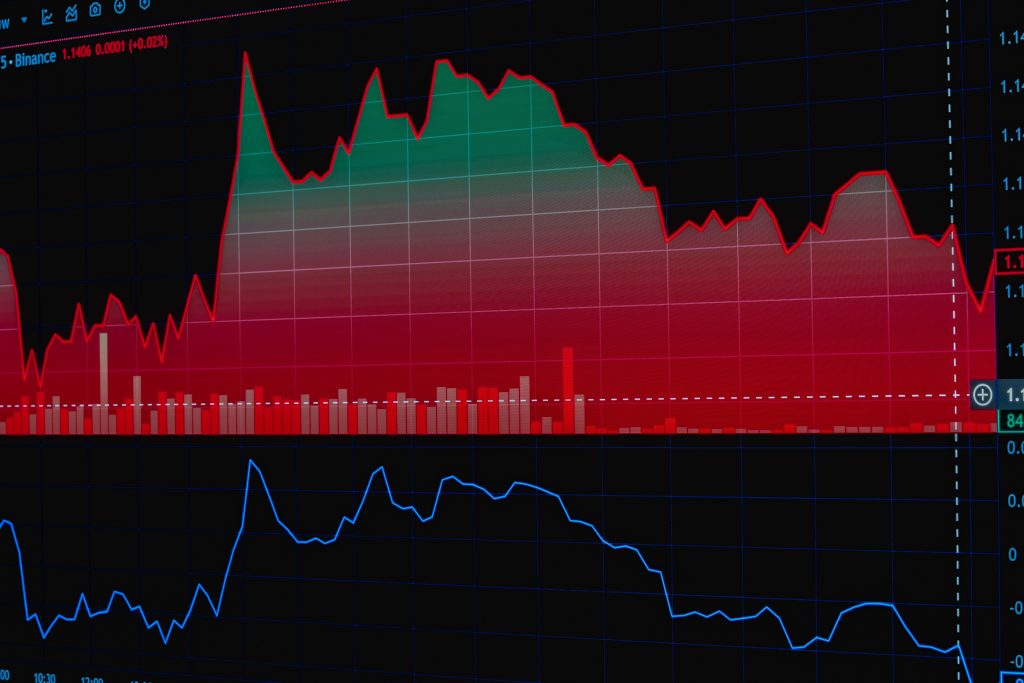
Most technical analysis starts with a price chart. The most common types are:
• Line charts: Connect closing prices over time. Simple and useful for spotting overall trends.
• Bar charts: Show the open, high, low, and close (OHLC) for each period.
• Candlestick charts: The most popular for beginners and professionals alike. Each “candle” displays the open, high, low, and close. A green (or white) candle typically means the price closed higher than it opened; a red (or black) candle means it closed lower. The thin lines above and below the body are called wicks or shadows.
Time frames matter. A pattern on a daily chart carries different weight than the same pattern on a 5-minute chart. Beginners often start with daily or weekly charts to reduce noise.
Common Chart Patterns

Chart patterns are formations created by price movements that technical analysts believe have predictive value. They generally fall into two categories: reversal patterns (suggesting a trend may change direction) and continuation patterns (suggesting the existing trend may resume).
Reversal Patterns
• Head and Shoulders / Inverse Head and Shoulders: A head-and-shoulders top forms after an uptrend and consists of three peaks—the middle one (the head) higher than the two shoulders. A neckline connects the lows between the peaks. A break below the neckline is often viewed as a bearish signal. The inverse version appears after a downtrend and is considered bullish.
• Double Top and Double Bottom: A double top looks like the letter “M” and can signal a potential trend reversal from up to down. A double bottom resembles a “W” and may indicate a shift from down to up.
• Rounding Top or Bottom: Gradual, curved formations that can signal slower, longer-term reversals.
Continuation Patterns
• Flags and Pennants: Short-term consolidation patterns that appear after a strong price move (the flagpole). Flags are rectangular; pennants are small symmetrical triangles. They often resolve in the direction of the prior trend.
• Triangles: Symmetrical, ascending, or descending triangles form as price consolidates with converging trendlines. Breakouts from these patterns are watched closely.
• Rectangles / Trading Ranges: Price moves sideways between clear support and resistance levels before eventually breaking out.
Support is a price level where buying interest has historically been strong enough to prevent further declines. Resistance is where selling pressure has tended to cap advances. When price breaks through these levels with conviction (often confirmed by volume), traders pay close attention.
Popular Technical Indicators
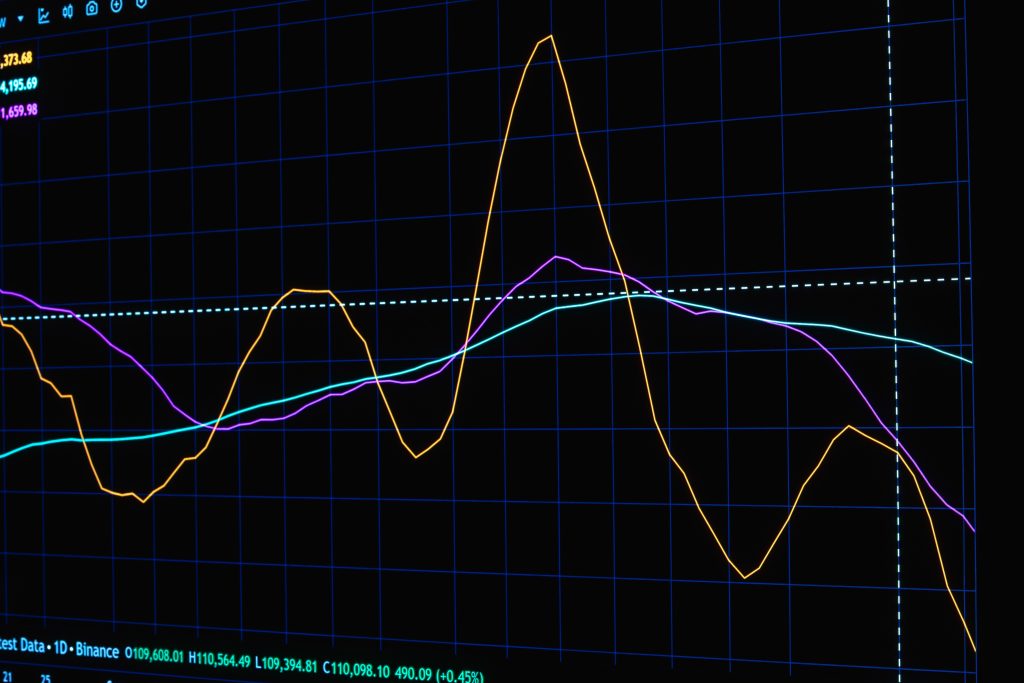
Indicators are mathematical calculations based on price and/or volume. They help quantify trend strength, momentum, volatility, and potential turning points. No single indicator works in all market conditions; most traders use a combination.
Trend-Following Indicators
• Moving Averages (MA): Smooth out price data to show the underlying direction. A simple moving average (SMA) gives equal weight to each period; an exponential moving average (EMA) gives more weight to recent prices. Common uses include the 50-day and 200-day moving averages.
A “golden cross” (shorter MA crossing above a longer MA) is often seen as bullish; a “death cross” is viewed as bearish.
• Moving Average Convergence Divergence (MACD): Combines two EMAs and a signal line to show momentum and potential trend changes. Crossovers and divergences from price are commonly watched.
Momentum Oscillators
• Relative Strength Index (RSI): Measures the speed and magnitude of recent price changes on a scale of 0 to 100. Readings above 70 are often considered overbought; readings below 30 are considered oversold. Divergences between RSI and price can sometimes foreshadow reversals.
• Stochastic Oscillator: Compares a closing price to its price range over a given period. Like RSI, it helps identify overbought and oversold conditions.
Volatility Indicators
• Bollinger Bands: Consist of a middle moving average with upper and lower bands set a certain number of standard deviations away. Price tends to stay within the bands. Squeezes (narrow bands) can precede larger moves; touches of the outer bands may signal short-term extremes.
Volume
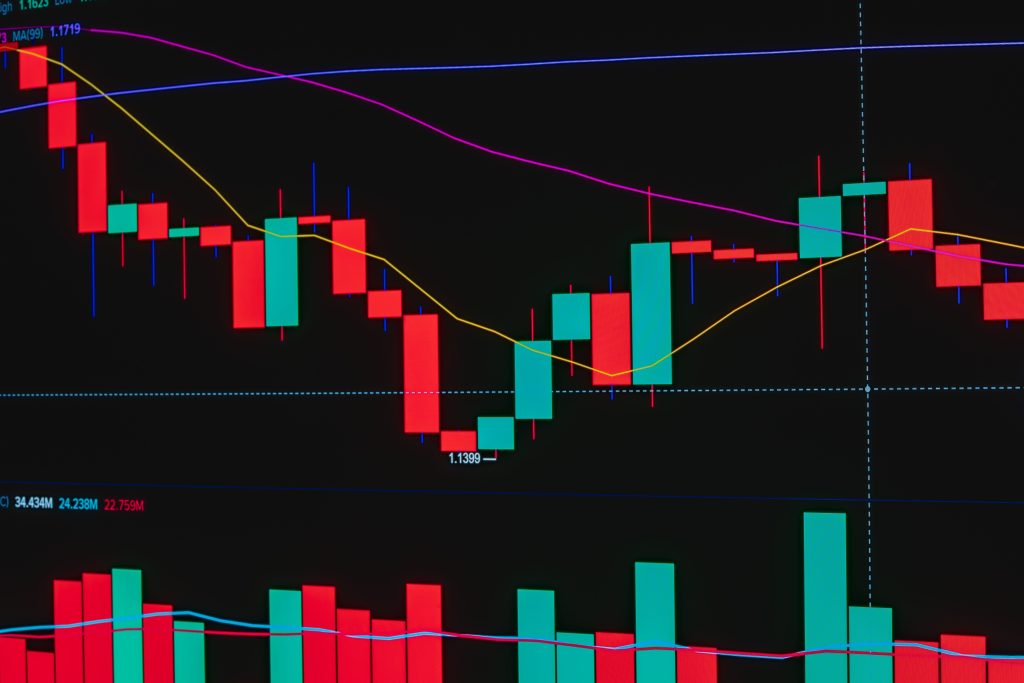
Volume confirms price moves. Rising prices accompanied by increasing volume are generally viewed as stronger than moves on low volume. Volume spikes often accompany breakouts or climactic turning points.
Putting It Together: A Practical Approach for Beginners
1. Start with the bigger picture—identify the primary trend on a higher time frame.
2. Look for well-defined chart patterns or key support/resistance levels.
3. Use one or two indicators for confirmation rather than overcrowding the chart.
4. Pay attention to volume for added conviction.
5. Always consider risk management: define your entry, exit, and position size before entering a trade.
6. Practice on historical charts or in a demo account before risking real capital.
Important Limitations
Technical analysis is not a crystal ball. Patterns fail, indicators give false signals, and unexpected news can overwhelm any chart setup. Markets are influenced by fundamentals, sentiment, and random events. Many successful traders combine technical tools with broader market context and strict risk controls.
Over-reliance on any single pattern or indicator is dangerous. What worked in one market environment may underperform in another. Continuous learning, journaling trades, and reviewing both wins and losses are essential for improvement.
Final Thoughts
Technical analysis offers a structured way to read price action and make more informed decisions about timing entries and exits. By learning to recognize major chart patterns and understanding a handful of core indicators, beginners can move beyond guesswork and develop a repeatable process.
Mastery comes with screen time and deliberate practice. Approach charts with curiosity and discipline, respect the limitations of the tools, and never risk more than you can afford to lose. Over time, the language of charts becomes clearer—and the art of technical analysis less mysterious.