
Supply and demand form the foundation of price movement in every financial market. Whether you trade stocks, forex, commodities, or cryptocurrencies, understanding how these two forces interact is essential for reading charts and making informed decisions.
The Basic Principle
In simple terms:
• Demand represents buyers. When more people want to buy an asset than sell it, demand rises and price tends to go up.
• Supply represents sellers. When more people want to sell an asset than buy it, supply rises and price tends to go down.
Price is the mechanism that balances the two. When demand exceeds supply at a given price level, the market moves higher until enough sellers appear. When supply exceeds demand, the market moves lower until enough buyers step in. Equilibrium occurs when the quantity buyers are willing to purchase roughly matches the quantity sellers are willing to offer.
This principle, rooted in classical economics, applies continuously in liquid markets because prices update in real time based on order flow.
How Supply and Demand Appear in Trading
In trading, supply and demand are not abstract curves on a textbook graph. They show up as areas of imbalance on the price chart.
• Strong buying pressure (demand) often creates sharp upward moves or long-legged candles that leave behind a zone where buyers previously absorbed selling.
• Strong selling pressure (supply) creates sharp downward moves or rejection candles that leave a zone where sellers overwhelmed buyers.
These zones frequently act as future support (demand zones) or resistance (supply zones). Price often reacts when it returns to them because residual orders or the memory of previous imbalances can still influence participants.
Supply and Demand Zones Explained

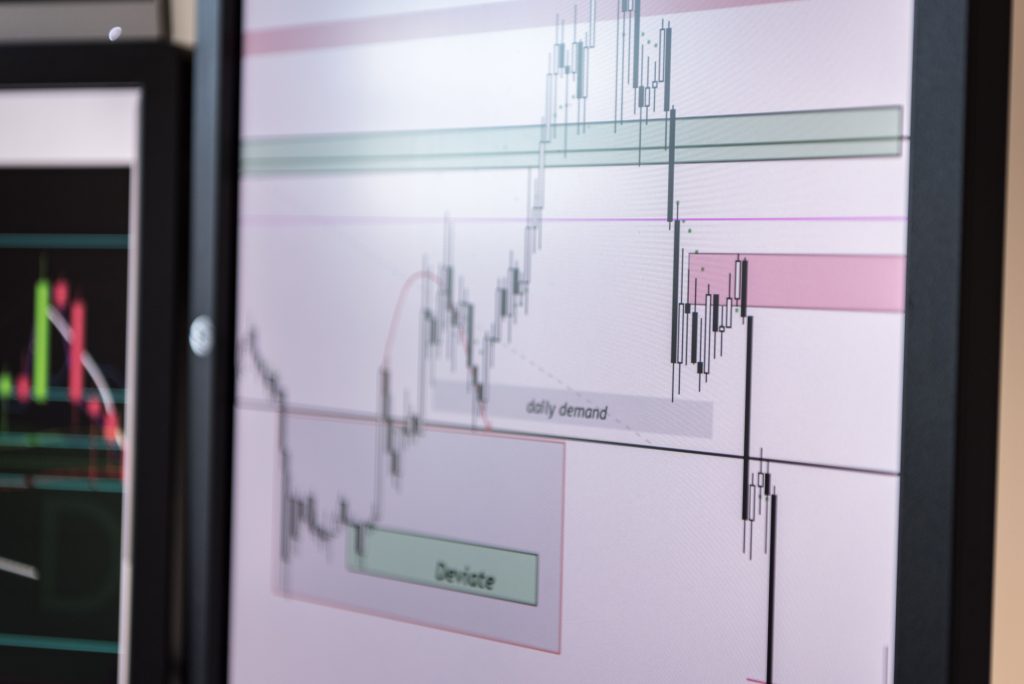
Traders mark demand zones as price areas where a strong rally originated, usually after a period of consolidation or a clear rejection of lower prices. These zones show where buyers were aggressive enough to reverse or accelerate price higher.
Supply zones are the opposite: areas where a strong decline began, indicating sellers stepped in forcefully.
Key characteristics of high-probability zones include:
• A clear impulsive move away from the area (strong candles with momentum).
• Relatively little price action or “base” before the move.
• Freshness — zones that have not been retested multiple times tend to hold better.
• Confluence with other factors such as round numbers, previous highs/lows, or higher-timeframe structure.
When price returns to a demand zone and shows signs of buying (bullish candles, absorption of selling, or a clear rejection), traders often look for long opportunities. The reverse applies at supply zones for short opportunities.
Practical Use in Trading
Traders apply supply and demand in several ways:
1. Identifying potential turning points — Zones help define areas where price may reverse or pause rather than relying solely on lagging indicators.
2. Risk management — Stops are often placed beyond the zone (below demand or above supply), giving a clear invalidation level.
3. Target setting — The next opposing zone frequently serves as a logical profit target.
4. Trend context — In an uptrend, traders prioritize demand zones for entries in the direction of the trend. In a downtrend, they focus on supply zones.
5. Order flow confirmation — Some combine zones with volume, volume profile, or footprint charts to see whether actual buying or selling is occurring at the level.
The concept works across timeframes. A daily demand zone can guide swing trades, while a 5-minute zone can support scalping, provided the higher-timeframe bias aligns.
Limitations and Realistic Expectations

Supply and demand zones are not magic lines. Markets can break through them, especially during news events, strong trends, or when larger institutional orders overwhelm the residual interest. Zones weaken after multiple tests as resting orders get filled. False breaks and liquidity grabs are common.
Successful use requires:
• Proper zone identification (quality over quantity).
• Context from market structure and higher timeframes.
• Confirmation rather than blind entries at the edge of a zone.
• Consistent risk management, because no zone has a 100% success rate.
Closing Thoughts
Supply and demand in trading simply means reading the imbalance between buyers and sellers as it appears on the chart. Price moves because one side temporarily overwhelms the other.
By identifying the areas where those imbalances previously occurred, traders gain a framework for anticipating where similar reactions may happen again.
Mastering the concept takes screen time and deliberate practice in marking zones, observing reactions, and reviewing outcomes. Once internalized, it provides a clearer lens for understanding why price behaves the way it does — and a practical tool for structuring trades around that behavior.